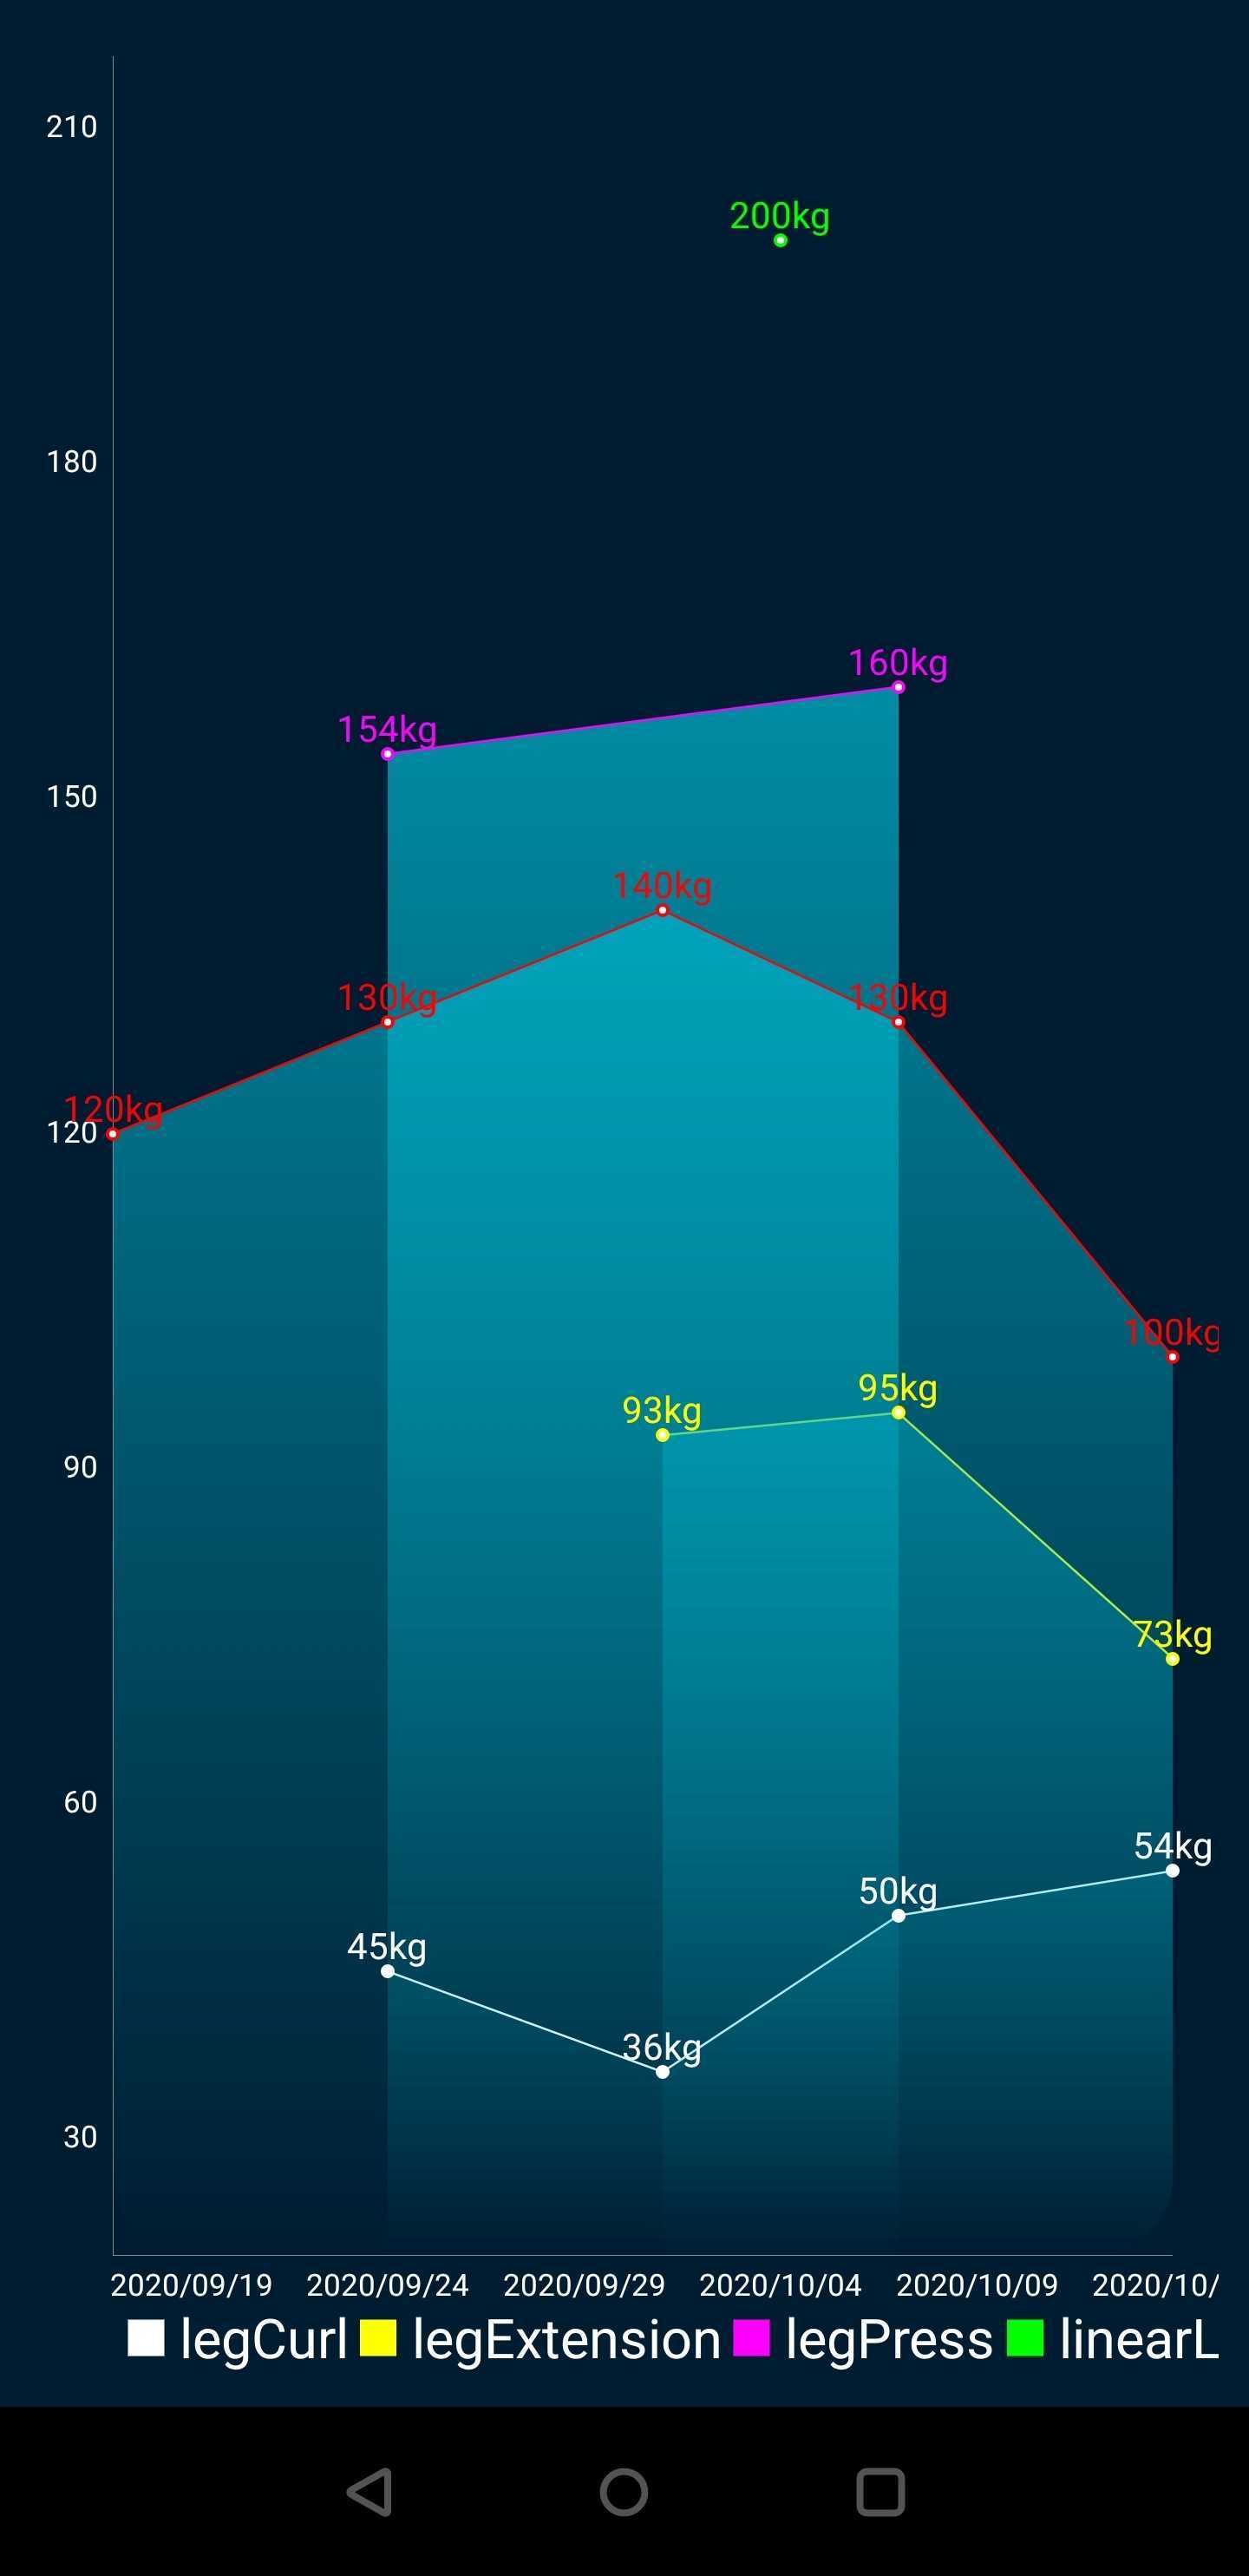
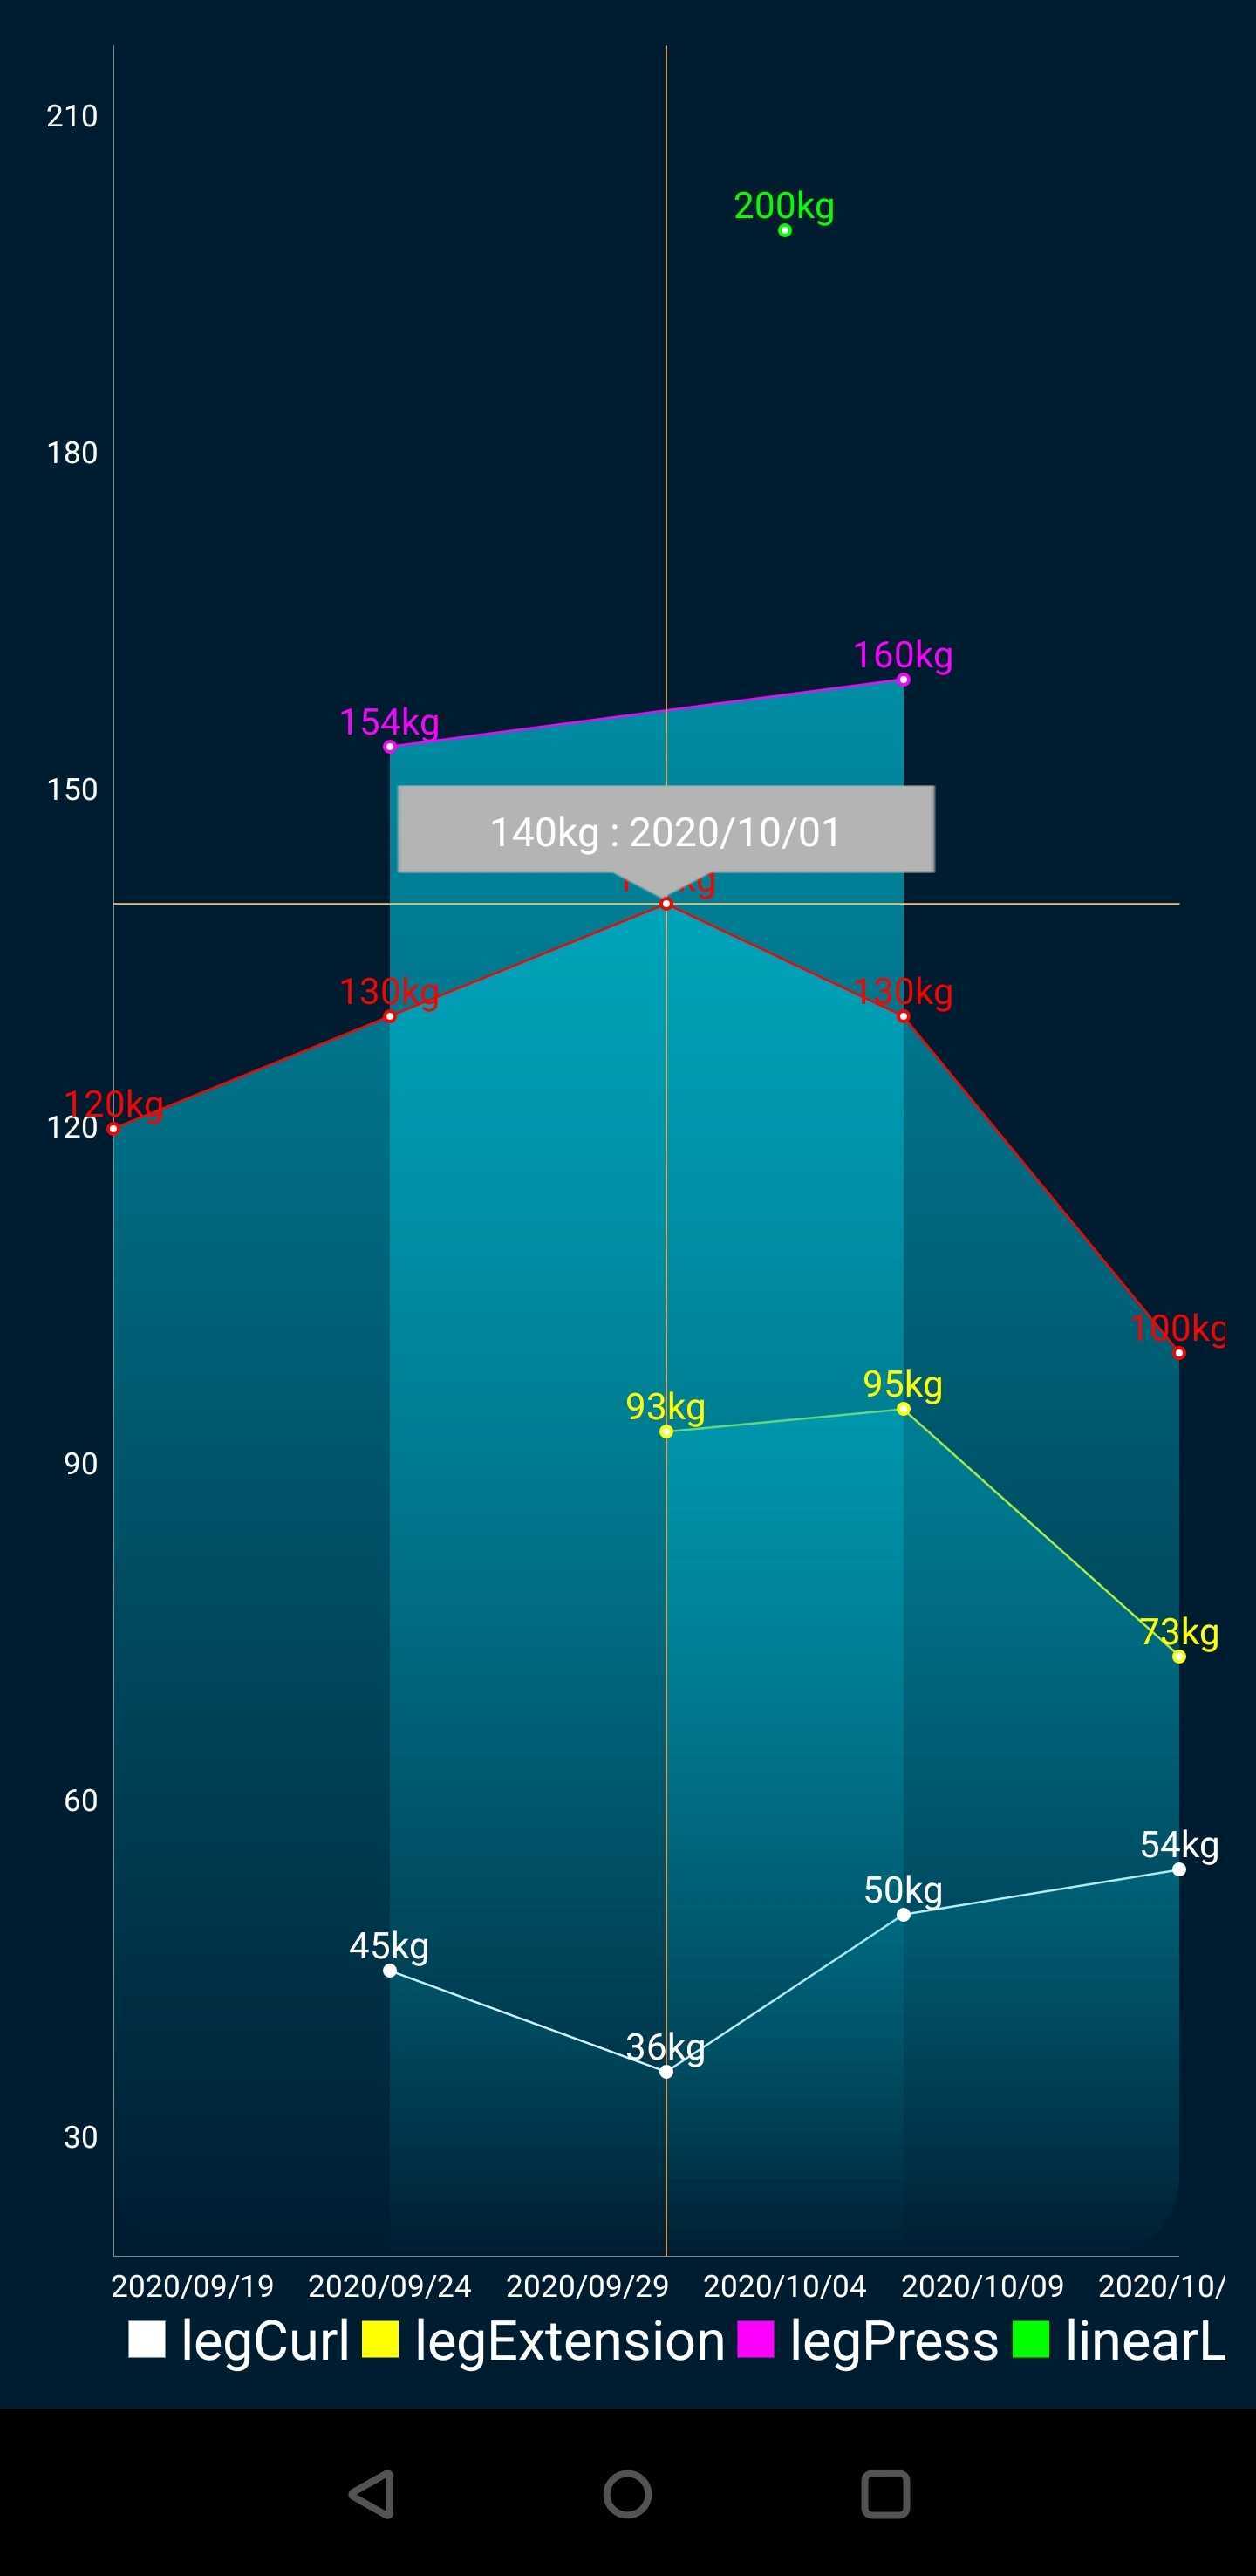
Charts
The library MPAndroidChart was used to display line charts.
For that you’ll need to import the alias chart
import chart
There are (for now) two kinds of charts
- LineChart: a line chart
- MultiLineChart : a chart allowing to display multiple lines
Each of these chart objects have a method show() allowing to show the chart.
By long clicking it, you can save it into a PNG file
The library allows to consider x values as timestamps, so that when you’ll show the charts, it will display the time in the x absyss. You’ll have to specify the time-unit for that
Example:
import chart
import time
chart = new LineChart()
x = []
for (i in (1..10)) x.add(LocalDateTime.now().minusDays(10 - i) as Long)
r = new Random()
y = []
for (i in (1..10)) y.add(r.nextInt(100))
chart.setX(x)
  .setY(y)
  .setTitle("example chart")
  .setTimeUnitX(HOURS)
  .setShowGrid(false)
  .setDrawValues(true)
  .show()
Javadoc
You can consult the javadoc here
Screenshots


If you long press the chart, you can save it in PNG format.